Last year, we released Hanelly Insights to make inroads in data-driven forecasting using machine learning and statistical analysis technology. This new module includes our comprehensive Turnover Analysis dashboard.
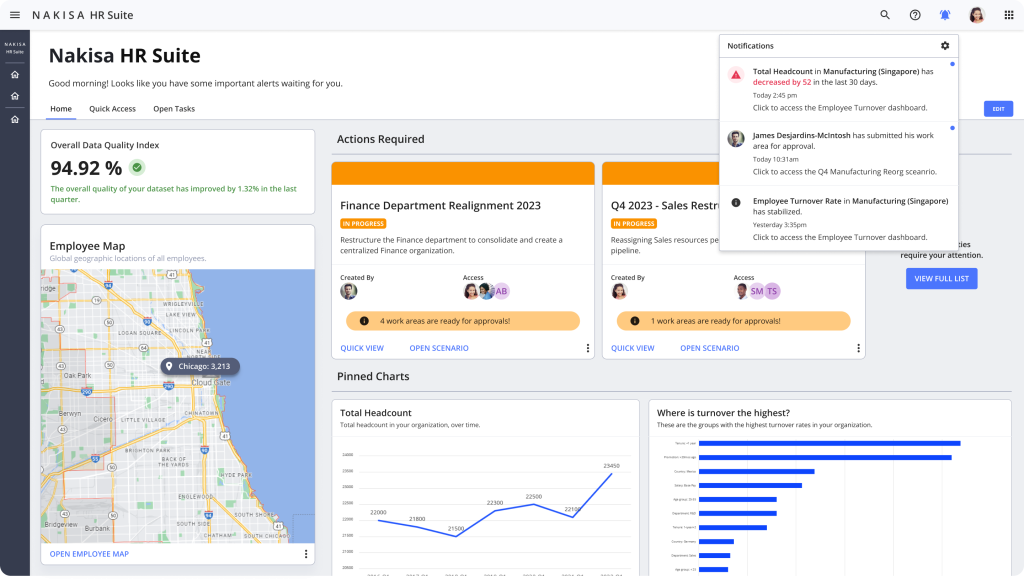
While you may be tracking turnover trends already, the COVID-19 pandemic has brought forward urgent considerations that must be addressed. Workforce retention experts are forecasting an increase in voluntary resignations in 2021 as employees resume job searches that were put on hold last year. Research also points to high levels of burnout and greater turnover among women during the COVID-19 crisis. Using the new Turnover Analysis Dashboard in conjunction with other Nakisa Hanelly Insights modules like Data Quality and DE&I dashboards can shine a light on these issues and help you make informed decisions that improve organizational policies, job designs, corporate culture, and company agility.
HR leaders can find correlations across multiple sources of employee and structural data to uncover key churn factors that often go unspoken. By flagging root causes, they can take proactive measures to reduce turnover and build stronger retention programs to protect performers with high risk of loss. The dashboard can also guide leaders to investigate workforce patterns and gaps, enabling you to create org models that improve the overall health of the company.
Turnover Analysis Overview
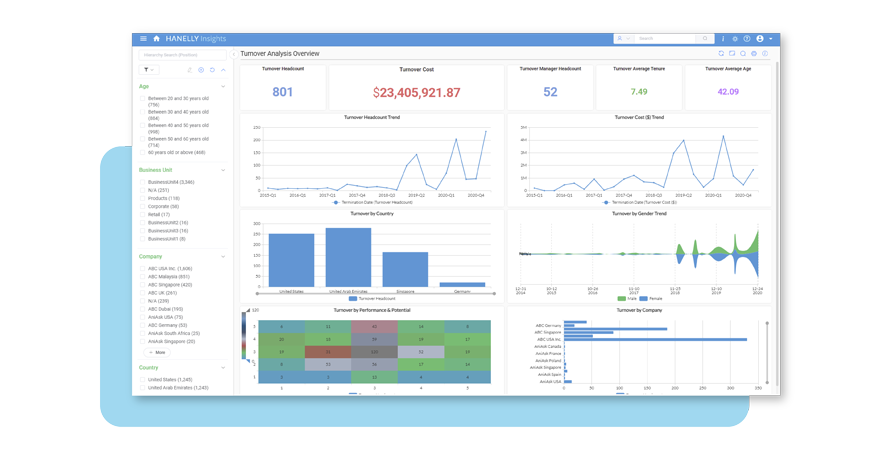
Gain a global overview of your turnover trends through charts, analytics and record details.
- Data is pulled from the Historic Employee Dataset
- Optional filters allow you to examine terminated employees only
Turnover Cost
Presents the total cost borne by the company after an employee leaves.
- Data such as critical resource value, manager value, tenure value and maximum salary scale value are automatically weighed when displaying turnover cost
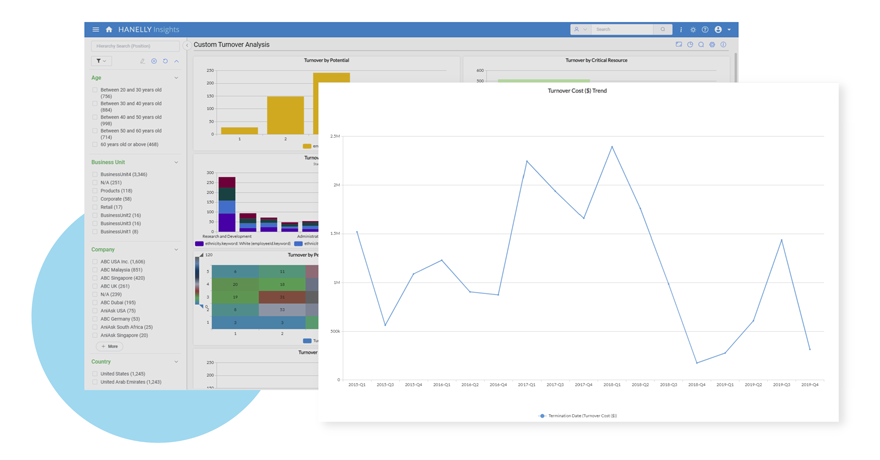
- Visualize turnover costs over time with Turnover Cost Trend
Turnover by Country
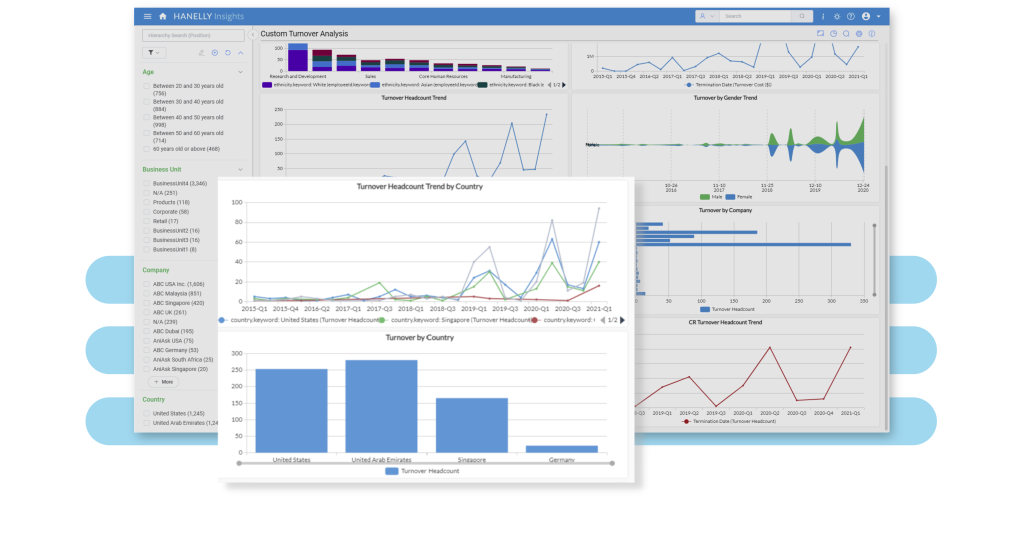
Displays the list of employees who left the organization filtered by country, making it easier to manage your global enterprise.
- Can be activated on a position or org unit basis
Turnover by Performance, Potential, Demographic, and Structural Filters
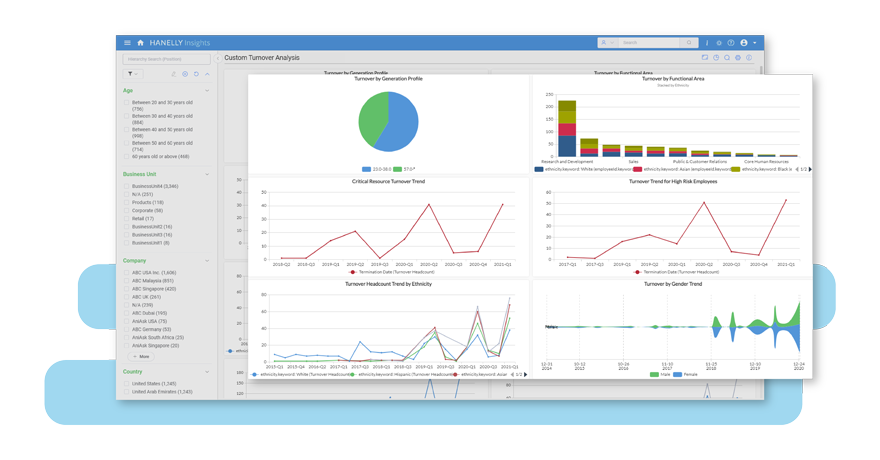
See turnover data correlated with up-to-date employee and organizational metrics.
- Understand the particularities of your workforce by exploring how gender, age, ethnicity, span of control, tenure, and other factors affect turnover
- Use these correlations to tailor your turnover contagion prevention strategy
- Create org structures and policies that ensure the long-term health of the company
Visualize turnover data in a new way: drill down to understand the driving factors of change, whether they be internal or external. Talk to us to see how all the Nakisa Hanelly Insights dashboards can work together to influence tomorrow’s decisions.